There’s an increasingly high cost to poor data quality today. Poor customer data costs companies six percent of their total sales, as per a UK Royal Mail study. And, as per IBM, bad data costs U.S. businesses $3.1 trillion per year.
As companies transform into data-driven businesses, we witness a sharp interest in data observability. While businesses use data-first strategies, only 27% of organizations have full observability over their stack, which means businesses leave money and opportunities on the table.
Businesses that achieve data observability report a 69% faster MTTR (mean time to recovery), an essential metric for companies to optimize. Data continues to be at the core of critical business decisions and business continuity in a fast-paced environment, making data observability increasingly important.
Let’s back up a few steps and learn all about data observability in this guide.
What is Data Observability?
Data observability is a set of practices that lend the ability to understand, diagnose and manage data health across an organization’s technology infrastructure through the data lifecycle. With observability, data and analytics professionals monitor the quality, reliability and delivery of data while also deriving insights to identify and address issues.
In simpler words, observability is the ability to comprehend a system’s internal state based on external outputs. An observable system allows users to identify the root causes of incidents by looking at its data without performing additional coding or testing. It’s based on an engineering concept called control theory, which refers to the capability to assess internal issues from the outside.
The concept of data observability was ideated by Barr Moses, co-founder and CEO of a software vendor Monte Carlo Data, in 2019 through a blog post (updated in 2023) about applying the general principles of observability for IT systems to data.
Part of Barr’s original definition reads, “Data observability eliminates data downtime by applying best practices learned from DevOps to data pipeline observability.” Data downtime comprises the period when data is erroneous, partial, incomplete or inaccurate.
Data downtime becomes an exponentially bigger issue as data systems get complicated and support a proliferating ecosystem of sources and consumers. Since this is the definition of modern IT infrastructure, data downtime is a leading issue and data observability a necessary function.
The Pillars of Data Observability
Barr Moses outlines the five pillars of data observability as:
- Freshness – For companies to derive timely and relevant insights from their data and use them reliably for decision-making, the data must be fresh and timely. This pillar concerns how up-to-date your data is and how frequently it is updated.
- Quality – Data is high-quality and worth processing when its values are within accepted ranges. The data quality pillar considers aspects such as percent NULLS and percent uniques to determine whether or not a data table is fit for use.
- Volume – This pillar assesses the completeness of your data by examining whether data tables contain the appropriate number of rows and columns so that possible issues in the source systems can be identified.
- Schema – This pillar requires auditing and monitoring changes to the data organization, as schema changes often point to broken data and cause data downtime.
- Lineage – Defining the lineage involves documenting and knowing the organization’s upstream data sources and downstream ingestors, besides understanding which teams are generating and accessing the data. Good lineage also captures information about the data, or metadata, regarding the governance, technical and business guidelines for specific data tables. Lineage helps discover where the data broke in the face of an incident.
Why Organizations Need Data Observability Today
Organizational IT infrastructure is becoming increasingly complex- consider a shift from the monolith to microservices- making it necessary for DevOps teams in engineering departments to keep a constant tab on system health and leverage continuous integration and development approaches.
Observability is a recent, though equally necessary, addition to the software industry and addresses this need to monitor, track and triage incidents to prevent services or applications downtime.
Traditionally, enterprises had limited ways to store and process data, often placed in a centralized repository, ingested from a fixed number of data sources. Today, organizations generate large volumes of data from different systems and collect more from external sources.
Building multiple data warehouses or transferring the data from the source to this repository can become expensive beyond measure. Furthermore, the goal for organizations is not just to store but also to analyze this data and find meaningful insights that prevent security incidents, ensure compliance and offer business-related insights.
This is where and why data observability comes in.
Why is Data Observability Critical for Business?
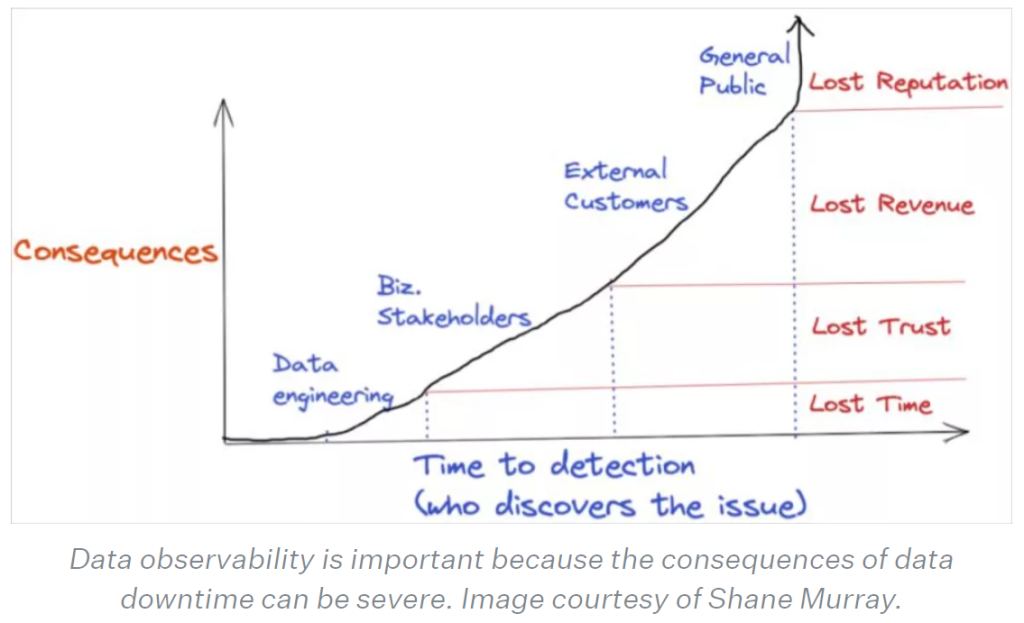
Data downtime leads to a loss of time and resources for data engineers and developers. And it leads to the erosion of trust in data consumers. In that regard, data observability becomes invaluable for business functions.
As the image shows, data observability can help prevent consequences such as loss of time, trust, revenue and reputation from incidents by minimizing the time to detect and fix incidents.
This brings us to the key metrics that help measure and prove the impact of observability on business performance- time to detection and time to resolution. Mean Time to Detect or MTTD and Mean Time to Resolve or MTTR are two of the most crucial metrics that show the health of an IT system.
The lower these metrics, the better the health of an IT infrastructure. However, to detect and resolve incidents quickly, businesses need one eye on data at all points. This is the function of monitoring solutions. So, how is data observability different from monitoring?
What is the Difference Between Observability and Monitoring?
An incident in an organization’s service or application impacts the customer experience and the business. IT teams need to quickly discover the root cause of incidents to resolve them. Monitoring and observability both help identify root causes.
A key difference is that monitoring tells you when something smells weird, while observability can tell you what smells, why and how to fix it. Monitoring is reactive, while observability is proactive.
Both observability and monitoring rely on the same type of data called telemetry:
- Logs – A record of the ongoing happenings in a software system.
- Metrics – A quantitative assessment of application performance and resource utilization.
- Traces – The way operations move from one node to another in a system.
However, the difference lies in whether data pulled from an IT system is predetermined. Monitoring solutions collect and assess predetermined data through previously designed dashboards. Since the dashboards are created by your team, monitoring only uncovers issues that you know to look for.
You don’t know what you don’t know. When complex cloud-native applications come into the picture, monitoring isn’t enough. Observability takes monitoring a step further by using telemetry data from across the IT infrastructure to proactively uncover potential issues that teams may not have anticipated.
Observability solutions also know to automatically discover new telemetry sources within your IT infrastructure and build them into the dependency mapping (automatically produced). Then, some observability platforms include machine learning and AIOps (artificial intelligence for operations) capabilities to gather insights from a large volume of data across a complex IT environment.
Observability can also be seen as an evolution of application performance monitoring (APM) that allows monitoring today’s IT environments with agile development, many programming languages, DevOps, microservices, serverless and other cloud-native technologies.
Observability makes monitoring fast, contextualized and automated. Since data observability is only one type of observability, let’s learn about all of them.
What are the Types of Observability?
There are three kinds of observability based on how engineers use it to troubleshoot issues in different areas of business.
- System/infrastructure observability
Infrastructure observability revolves around latency, resource utilization and failures in the software. SREs (software reliability engineers), DevOps engineers and IT support teams use system observability.
For instance, if a site shows latency issues, it might leak revenue as slow load times affect customer experience. With infrastructure observability, concerned teams get notified of the site latency.
Then, they can assess specific queries and sub-queries leading to delays in site response, finally getting to the root cause of the issue.
- Data observability
As we’ve been discussing, data observability enables teams to understand, assess and manage data health through its lifecycle. Data engineers and analytics engineers build and operate data pipelines to ensure the timeliness, quality and completeness of data.
For instance, an issue in data could be as simple as negative values for customer age. Causes of stale data include anomalies in the data source or infrastructure and code changes during one of the various data transformation stages.
Data observability would flag such anomalies across all data pipelines and prevent outages. This matters as data is the oil in modern IT environments.
- Machine learning observability
A relatively new kind of observability, ML observability includes developing, productionizing and operating ML models. Increasingly, business economic value relies on machine learning models. A low-performance ML model can lead to reputation loss, non-ideal business decisions and revenue loss.
For instance, a. Insurance company’s fraud detection ML model flags anomalous behavior with a new set of inputs never seen before. This could point to a breach or scam. ML observability allows you to act on this information before it harms business.
ML models evolve and maintain a dynamic baseline to flag anomalous behavior, also maturing your IT resilience.
Data Observability Tools and How to Choose One
When a data job collapses in one environment, other data environments must learn about it and react to it so that the damage does not spread. So, observable, self-treating and responsive data flows are essential in the modern IT enterprise.
Here’s what to look for in a data observability tool-
- A data observability platform must fit into your current architecture and operations ecosystem. It should have easy integrations across your current systems.
- A new data observability tool will involve a learning curve for users. So, it’s important to consider the training, outsourcing and hiring requirements to efficiently leverage the tool.
- The data observability system must align with data quality management processes such as monitoring, alerting, tracking, logging and analytics.
Top data observability tools include-
Acceldata
Acceldata offers data observability for Hadoop, the cloud and the enterprise with capabilities such as data pipeline monitoring, multilayer observability, end-to-end data reliability and quality, extensive cloud capabilities and compute and cost optimization.
A caveat for Acceldata is that it might not be effective in an organization using multiple external monitoring tools.
Databand
Databand provides a data observability platform with proactive capabilities to detect and resolve data incidents early in the development cycle. It also allows teams to collect metadata, profile behavior, detect and alert on incidents and triage data quality issues. It also supports an open-source library to build custom extensions.
IBM acquired Databand in 2022, which makes the tool a good choice for organizations with an extensive IBM architecture.
Monte Carlo
The top features of Monte Carlo’s data observability tool include automated alerting, data catalogs and comprehensive observability. It ensures business data stays within the enterprise network and supports a fully automated system.
One caveat of using Monte Carlo is UI problems when working with a high data volume.
CloudFabrix
CloudFabrix’s observability capabilities rely on unified observability based on open source and open telemetry. Capabilities of CloudFabrix Observability include proactive monitoring and reporting, log and event ingestion and reporting, application traces ingestion and reporting, continuous asset and dependency discovery and anomaly detection and automated alerting.
A standout feature of CloudFabrix is the ability to bring AI/ML to the edge and closer to the data for faster response and highly efficient data management. Asset and full-stack context allow users to search, analyze and visualize data in the context of a specific asset or service for faster root cause analysis.
Learn more about CloudFabrix Observability platform use cases and benefits here.