Are your current expensive, traditional or legacy monitoring tool implementations holding you back? It may be time to look into Observability architectures.
Per Gartner: “Enterprises are becoming frustrated with the limitations of existing monitoring tools and, despite decades of investments in monitoring tools, continuing to rely on customers to notice an outage.”
Following are few common limitations that we observed with traditional/legacy monitoring tools:
- Unable to support modern workloads (microservices, containers, Kubernetes, cloud workloads…)
- Limited scalability due to rigid architecture – cause ux and performance issues
- Long lead times to support monitoring for new or 3rd party devices/apps
- Limited extensibility (reports/dashboards/alerting etc.)
- Closed loop systems – difficult to integrate with rest of IT toolchain and ecosystem
- Resource intensive (time and cost) to implment and maintain monitoring deployments
Given such limitations and setbacks with traditional tools, enterprise are looking for modern and next generation monitoring solutions.
Gartner specifically recommends I&O leaders to “Enable observability by selecting vendors and systems that utilize emerging open standards for collection, such as OpenTelemetry and OpenMetrics”
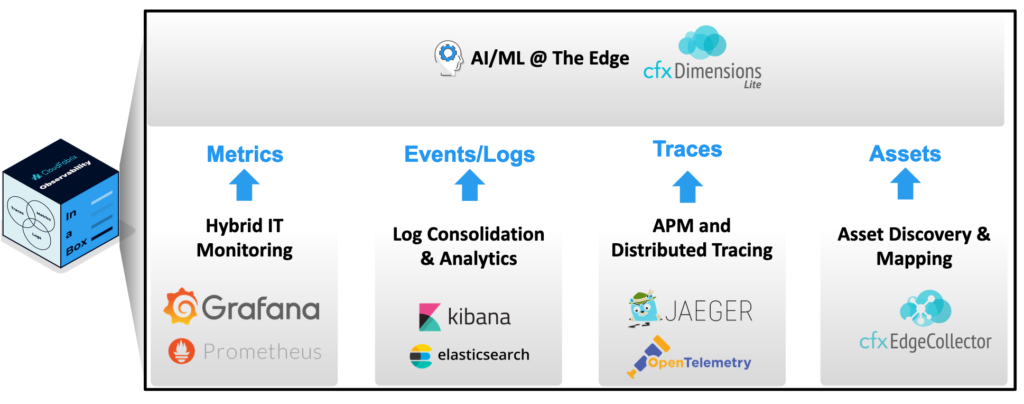
It is to address this very specific need of modern monitoring solution, we have introduced our Observability-in-a-Box solution that is built using open source and open telemetry components. Metrics, a key pillar of observability, are generated by our monitoring module, which has the following key components:
Prometheus: Monitoring backend for time series data, alerting etc.
Grafana: Frontend for visualization, dashboarding, reporting etc.
Both Prometheus and Grafana have become a popular monitoring tool of choice for many enterprise IT organizations. Prometheus provides the advantage of having extensive library of integrations to support monitoring of most IT systems and environments. In Prometheus parlance, agents are called as exporters, which can be installed easily on target nodes and they simply emit a HTTP end point that emits sensor data, which will be polled by Prometheus server on a periodic basis. It is this simplicity and completeness makes Prometheus a very popular choice when it comes to monitoring.
Customers who implement Prometheus exporters can later switch to any monitoring backend that supports metrics collection from Prometheus exporters. This provides great flexibility and investment protection for customers.
Use Cases:Typical use case include: IT Infrastructure Monitoring (ITIM):
- IT performance, availability and fault monitoring, alerting
- Traditional and modern apps
- Traditional IT infrastructure (compute, network, storage, firewall etc.)
- Cloud native workload monitoring on AWS, Azure, Google Cloud
CloudFabrix Solution Advantage: What makes CloudFabrix solution (when compared to off-the-shelf open source components) more appealing to our customers is in the way we added AI capabilities right at the edge and also made it really easy to consume this great technology.
Following are few key enhancements added by CloudFabrix solution
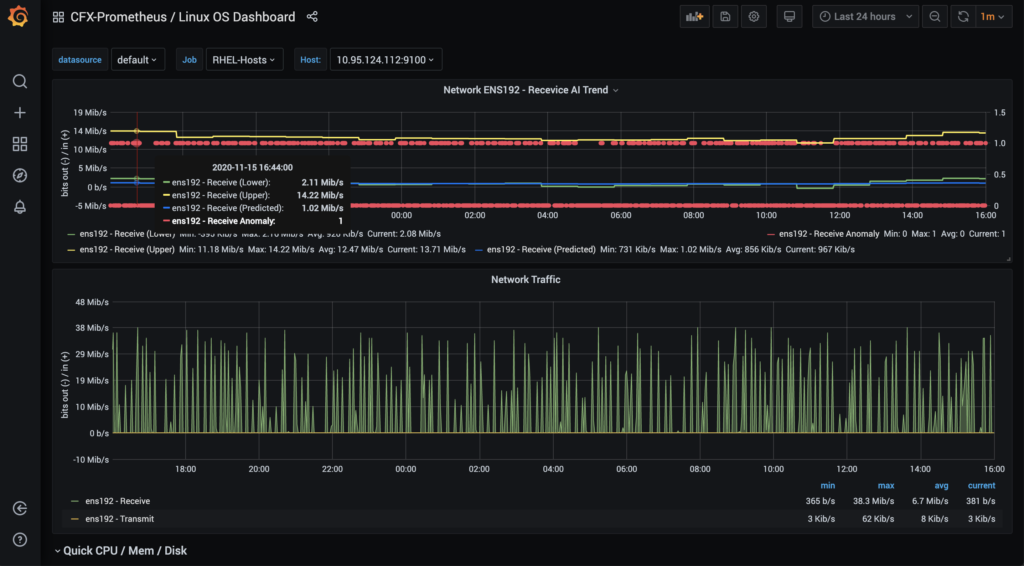
- AI inferencing on metrics data to do prediction, anomaly detection
- UI charts and widgets show AI inferences (predictions/anomalies)
- No code/low code way of onboarding workloads with profiles (monitoring, alerting configuration)
- Certification and packaging of most frequently used exporters
- Local LDAP server for authentication to individual components
- Self monitoring of Observability-Box (monitor the monitor)
- Script based installer to install all key components and their dependencies
- Flexible Packaging – Popular image formats (VMware, AWS, Azure) or Install on any Linux server