Anomaly detection, popularly known as outlier detection is a data mining process that aims to discover unexpected events or rare items in data and to determine details about their occurrences. Anomaly detection in time series data brings its own challenges due to seasonality, trends and the need to more complex multivariate analysis to yield better results.
In this multi-part blog series, we will discuss key aspects of anomaly detection, typical challenges that we encounter in doing anomaly detection for time series data, and finally discuss approaches for doing multivariate anomaly detection.
What is Anomaly Detection
Automatic anomaly detection is a critical aspect in today’s IT world where the sheer volume of data makes it impossible to tag outliers manually. Anomaly Detection can be used in IT Operations to trigger prompt troubleshooting, help avoid loss in revenue, and maintain the reputation and branding of the company. To serve this purpose, large companies have built their own anomaly detection services to monitor their business, product and service health. Anomalies once detected send out alerts to the IT Operators to make timely decisions related to incidents. It is extremely important to detect an Anomaly to run the ITOps smoothly, predict future interruptions and therefore prevent any incident that might lead to data damage and unnecessary resource spent. Also, the anomalies need to be detected at the right time to yield best results and avoid any false alerts that mislead the operations.
With the advent of Artificial Intelligence and AIOps platforms, the need for manual monitoring of anomalies and alerts has drastically reduced. Earlier human intervention was required at every level, to monitor and identify the anomalies within the ITOps. With AI changing the face of technology, a machine is trained to understand the pattern over a specific time period to detect and predict any existing or future anomalies on its own, without any human intervention.
Anomaly Detection in Time Series?
Static data is data with a start and end with limited time interval. Time series data is a sequence of data points that measure the same thing over an ordered period of time. Another way of thinking about it as a series of numerical values each with its own time stamp defined by a name and a set of labeled dimensions.
We are seeing this type of dataset become more common. If we look at developer usage patterns in the past two years time series databases have emerged as the fastest growing databases.
Static data is comparatively easy to yield and detect when compared to Time series data that is interdependent on Various dynamics. In time series, time is often the independent variable and the goal is usually to detect any Anomalies with respect to time. However, there are other aspects that come into play while dealing with time series.
- Is the data stationary?
- Is there a seasonality?
- Is there a Trend?
Factors Affecting Time Series Anomalies
Time series anomalies are majorly dependent on variables known as the STL Decomposition. To follow the pattern across a Time Series Data a process called the STL Decomposition is done, to weigh out the aspects that determine the anomalies with the Time Series Data.
Seasonality is a repeated pattern that is observed for a specific period of time after a certain time interval.
Eg: Thanksgiving and Christmas Sales bring in extra ordinary traffic in the e-commerce websites. It cannot be considered an anomaly since its a pattern that repeats itself every year.
Trend is the gradual and smooth increase of data over a long period of time. Trend is always a smooth, gradual and long-term change in data, which might not increase or decrease in the same direction throughout the specified interval time, thereby making trend a linear or non-linear curve.
Eg: The literacy rate growth across the world is in a linear increasing trend and it has taken place over several years and not a sudden crest or trough.
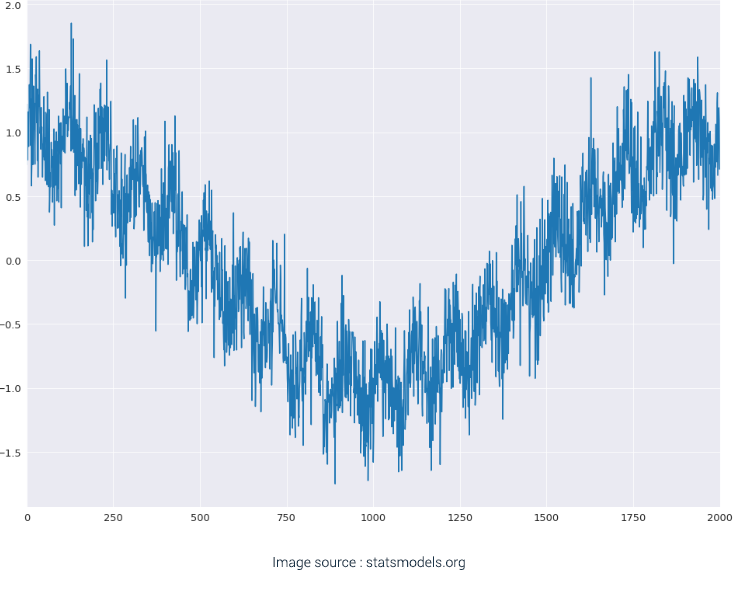
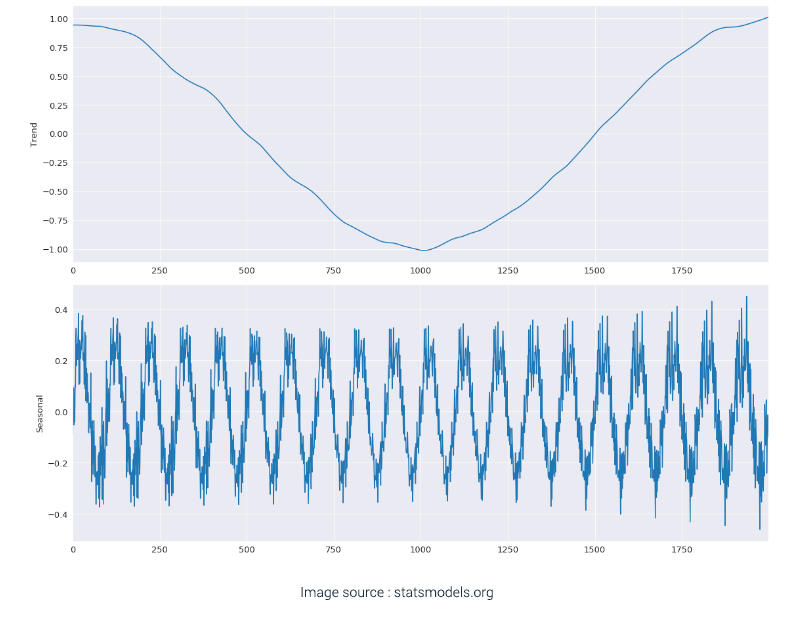
The below graphs are a visual example of sample data and the sample data decomposed into its Seasonality and Trend graphs.
The data that is left after fitting a model is called the Residue or Residual data. It is the difference between the observations and the corresponding fitted values.
Stages in Anomaly Detection
The entire process of Anomaly Detection takes place across three stages:
- Comprehend the data pattern and train the Machine Learning Model to fit a regression line by considering all the necessary variables (such as Trend, Seasonality, Residue, etc.)
- Create an upper and lower baseline with some threshold value (typically 3 standard deviations)
- Flag the data points which are beyond the baselines as anomalies.
In the next blog post, the details of the above stages approaches or techniques for achieving each stage shall be explored.