CloudFabrix solution provides a holistic approach for enterprises to implement proactive operations with the objective of eliminating/reducing critical incidents and improving customer satisfaction.
The solution primarily relies on applying regression/forecasting models on any time-series data to detect and forecast anomalies. One of the unique features of the solution is the ability to convert unstructured data such as logs/incidents/alerts into time-series data to be used for running prediction models.
While the technology allows the model to run on any time-series data, it may not be practical to do this across all the data points due to the sheer quantity of data in any given enterprise.
Hence we propose the following process to identify key data points by applying correlation algorithms between high-level KPIs and IT metrics/logs/traces. Once identified, the prediction models can be applied to them. This approach helps enterprises achieve the incident prevention/reduction objective in the most efficient way possible.
- Discover the key operational relationships and ensure that it is updated on a continuous basis
The following are the relationships that can be learned using the CloudFabrix solution
a) Management relationship – assets monitored by each monitoring tool
b) Metrics/logs/traces available for each asset
c) Relationships between assets
Assets referred here can be for both infrastructure and application. This can be accomplished using a combination of monitoring tools APIs, CMDB data, automated asset discovery, and other data sources (logs, netflow, APM traces, etc.)
- Identify key KPIs/Assets that need to be monitored continuously to reduce/eliminate critical incident situations.
This can be driven by a top-down approach where a business provides inputs on the business service KPIs. Alternatively, critical assets can be learned through historical data analysis, e.g., services/assets with high alerts/incidents, etc.
If business service KPIs are provided, the solution will identify the corresponding dependent assets using the asset dependency information.
- Find IT metrics/logs/traces that have a high correlation to the health and performance of the critical assets
ML algorithms are applied to learn these correlations – positive or negative.
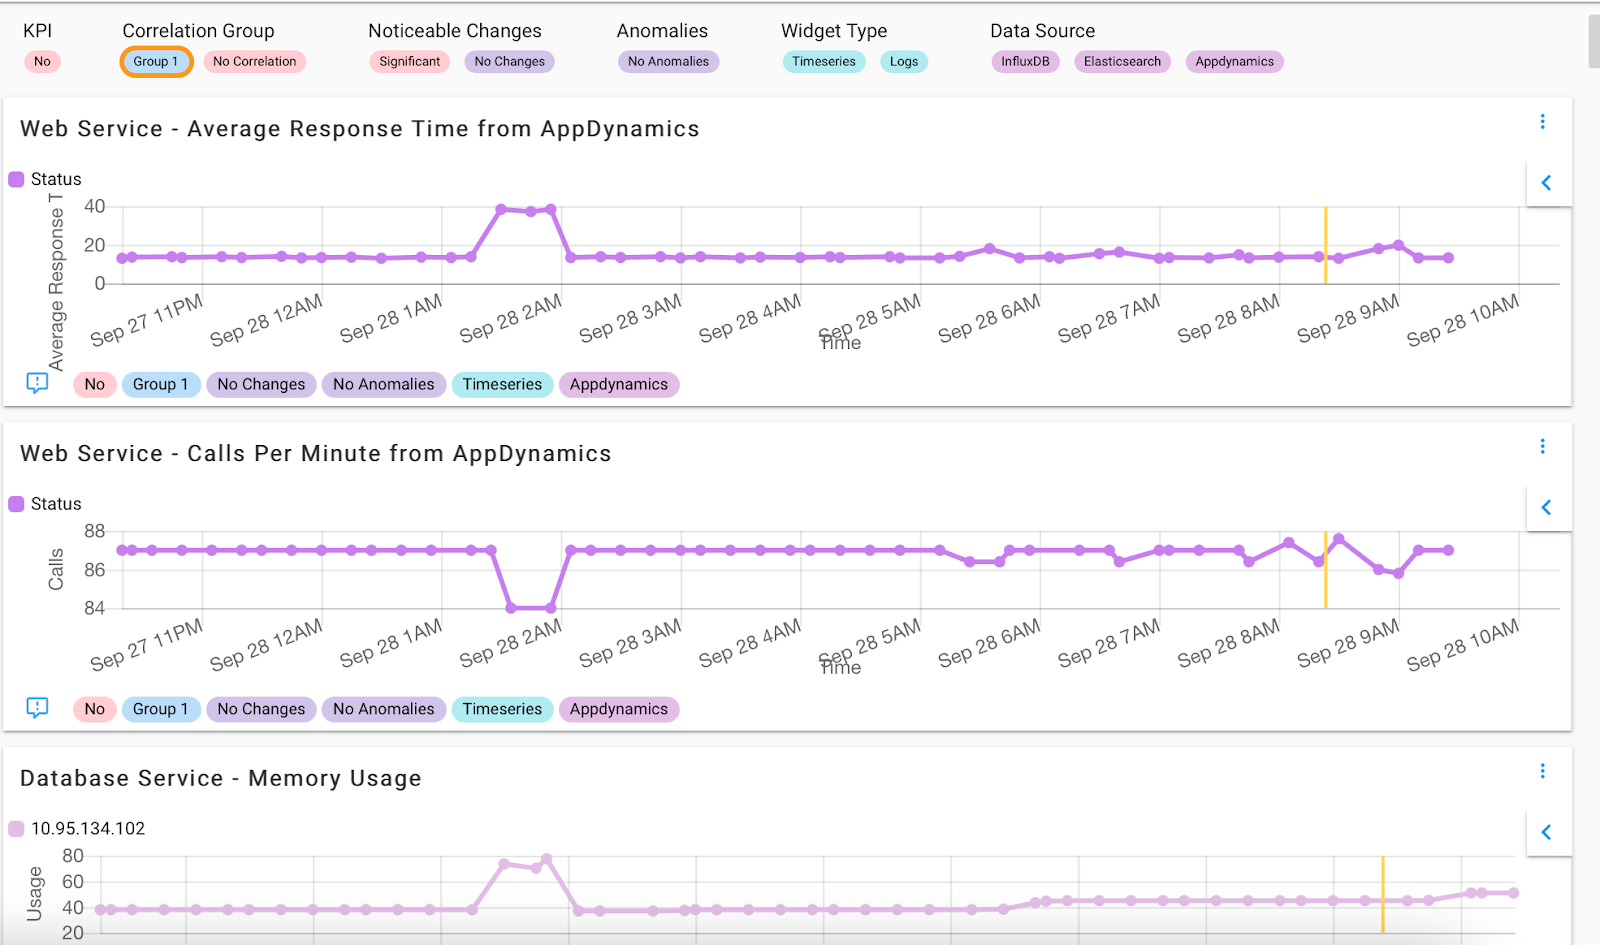
- Continuously monitor the identified observability data (time-series data point)
Once the key observability data is identified, that data will be collected and analyzed continuously:
a) To detect anomalies adjusted for the seasonality behavior
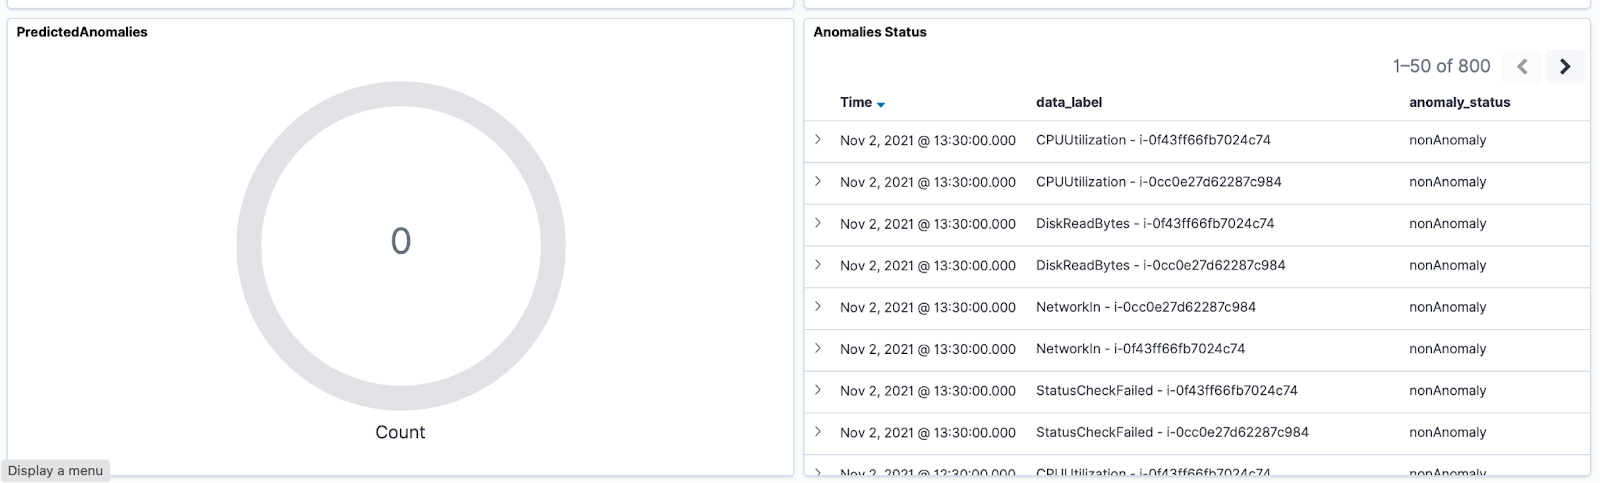
b) To predict anomalies and alert to initiate preventive measures. It will also forecast key insights for the time window of choice.
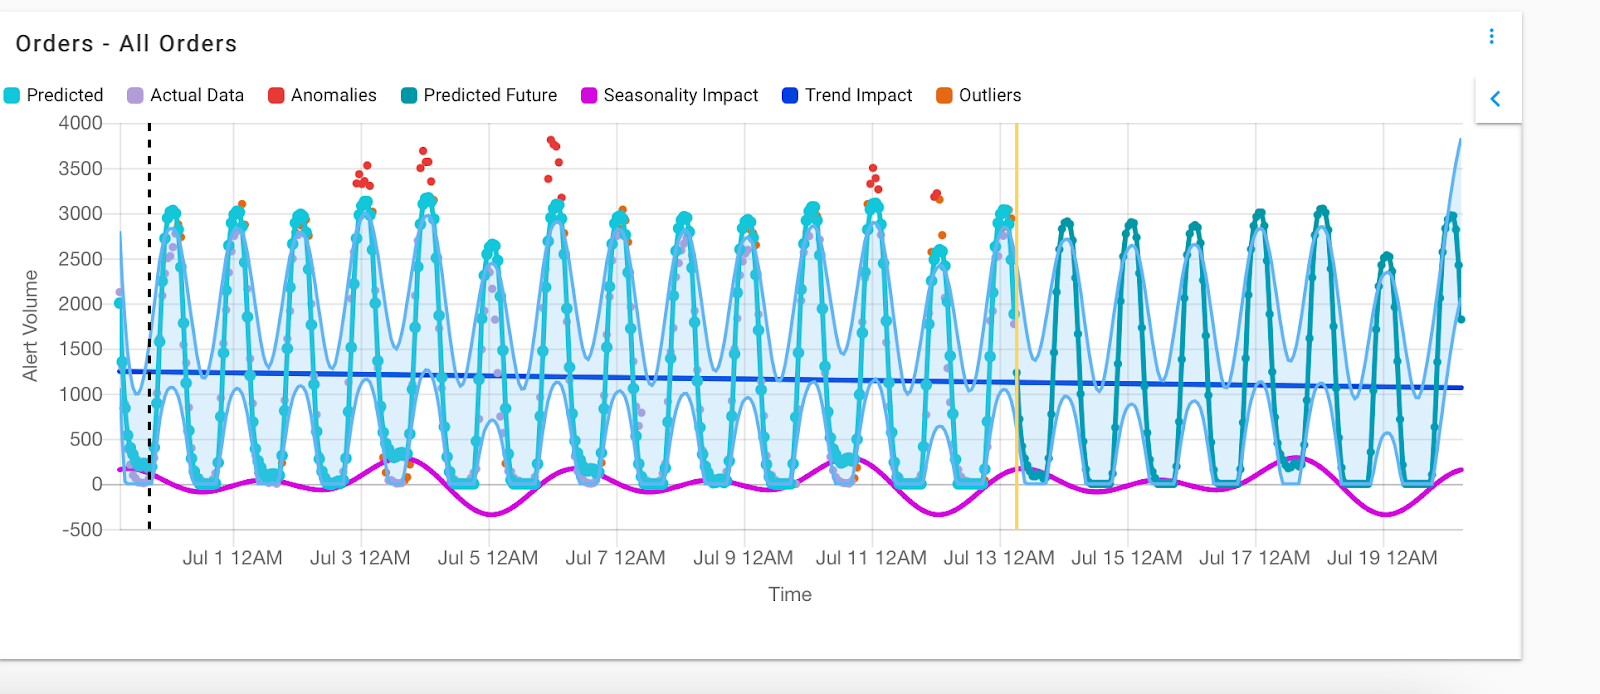
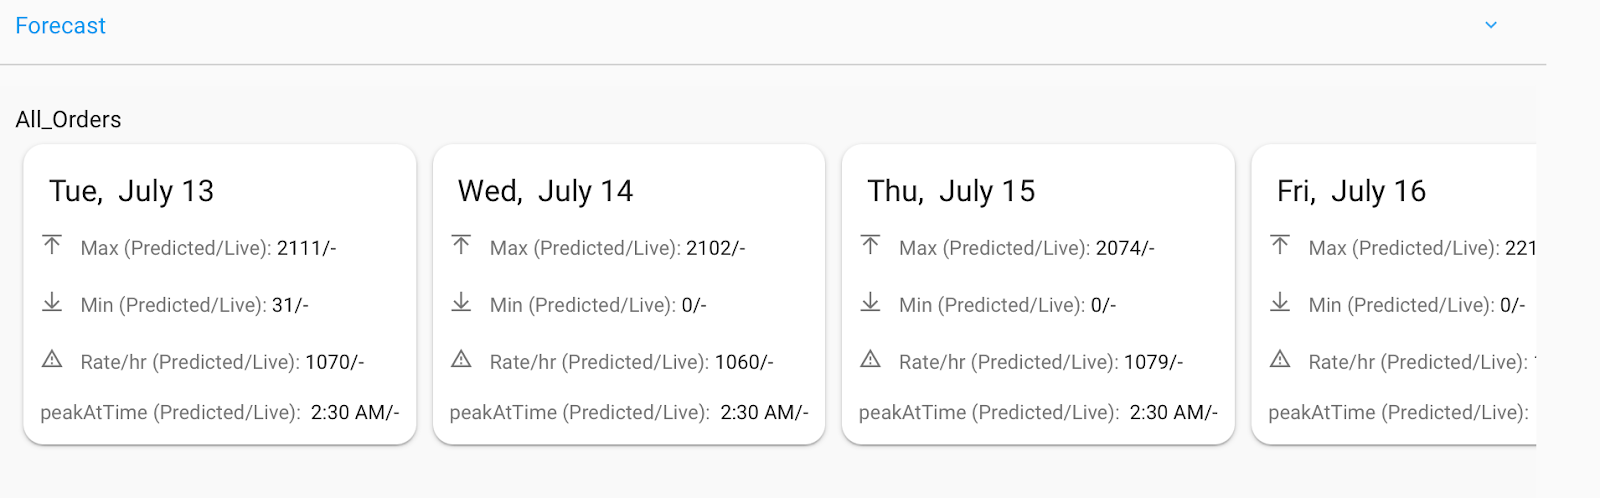
Forecasting Anomalies